- Welcome to Journal web site.
- 开发无止境 -
Data: 2017-05-31 22:40:43Form: JournalClick: 15
接上文:Go-Benchmark入门-基础篇(上)
本篇是进阶篇,围绕最佳实践,介绍项目中可能会用得上的一些技巧和科普更多的 benchmark 知识,也是对本人半个多月实践的一次总结和备忘。
go版本:
go1.19.4 darwin/arm64
默认情况下,benchmark只运行1秒钟,不过我们可以通过如下2个命令控制运行时长和测试轮次,以提高准确度:
-benchtime t
    Run enough iterations of each benchmark to take t, specified
    as a time.Duration (for example, -benchtime 1h30s).
    The default is 1 second (1s).
    The special syntax Nx means to run the benchmark N times
    (for example, -benchtime 100x).

-count n
    Run each test, benchmark, and fuzz seed n times (default 1).
    If -cpu is set, run n times for each GOMAXPROCS value.
    Examples are always run once. -count does not apply to
    fuzz tests matched by -fuzz.
根据 官方文档 ,我们看到 -benchtime 是 time.Duration 格式,小时分可以缩写为“h”、”m”、”s”单个字母,以下代表运行测试1小时10分10秒:
$ go test -bench="BenchmarkFibV2$" -benchtime=1h10m10s
另外,如果以x结尾,可以精确控制测试运行N次:
$ go test -bench="BenchmarkFibV2$" -benchtime=10x

goos: darwin
goarch: arm64
pkg: goexample/13_benchmark
BenchmarkFibV2-10             10               116.6 ns/op
PASS
ok      goexample/13_benchmark  0.414s
搭配 -count命令,我们可以精确控制测试运行多少时间(或多少次),以及运行几轮测试:
$ go test -run=none -bench="BenchmarkFibV2$" -benchtime=2s -count=3
goos: darwin
goarch: arm64
pkg: goexample/13_benchmark
BenchmarkFibV2-10       238259484                9.972 ns/op
BenchmarkFibV2-10       240662946                9.968 ns/op
BenchmarkFibV2-10       240829356                9.969 ns/op
PASS
ok      goexample/13_benchmark  10.420s
如上,我们每次测试运行2秒钟,总共运行了3次,我们看到平均每次耗时在 9.9 ns 左右,通过 -benchtime 和 -count 这2个命令,我们可以提升测试的准确定,避免性能毛刺或抖动。
我们可以使用 -benchmem 来观察代码的内存分配情况:
goos: darwin
goarch: arm64
pkg: server/msg-dispatcher/internal/dao
BenchmarkPushGroup_Create-10     855    1270851 ns/op    6138 B/op    142 allocs/op
PASS
ok      server/msg-dispatcher/internal/dao      1.563s
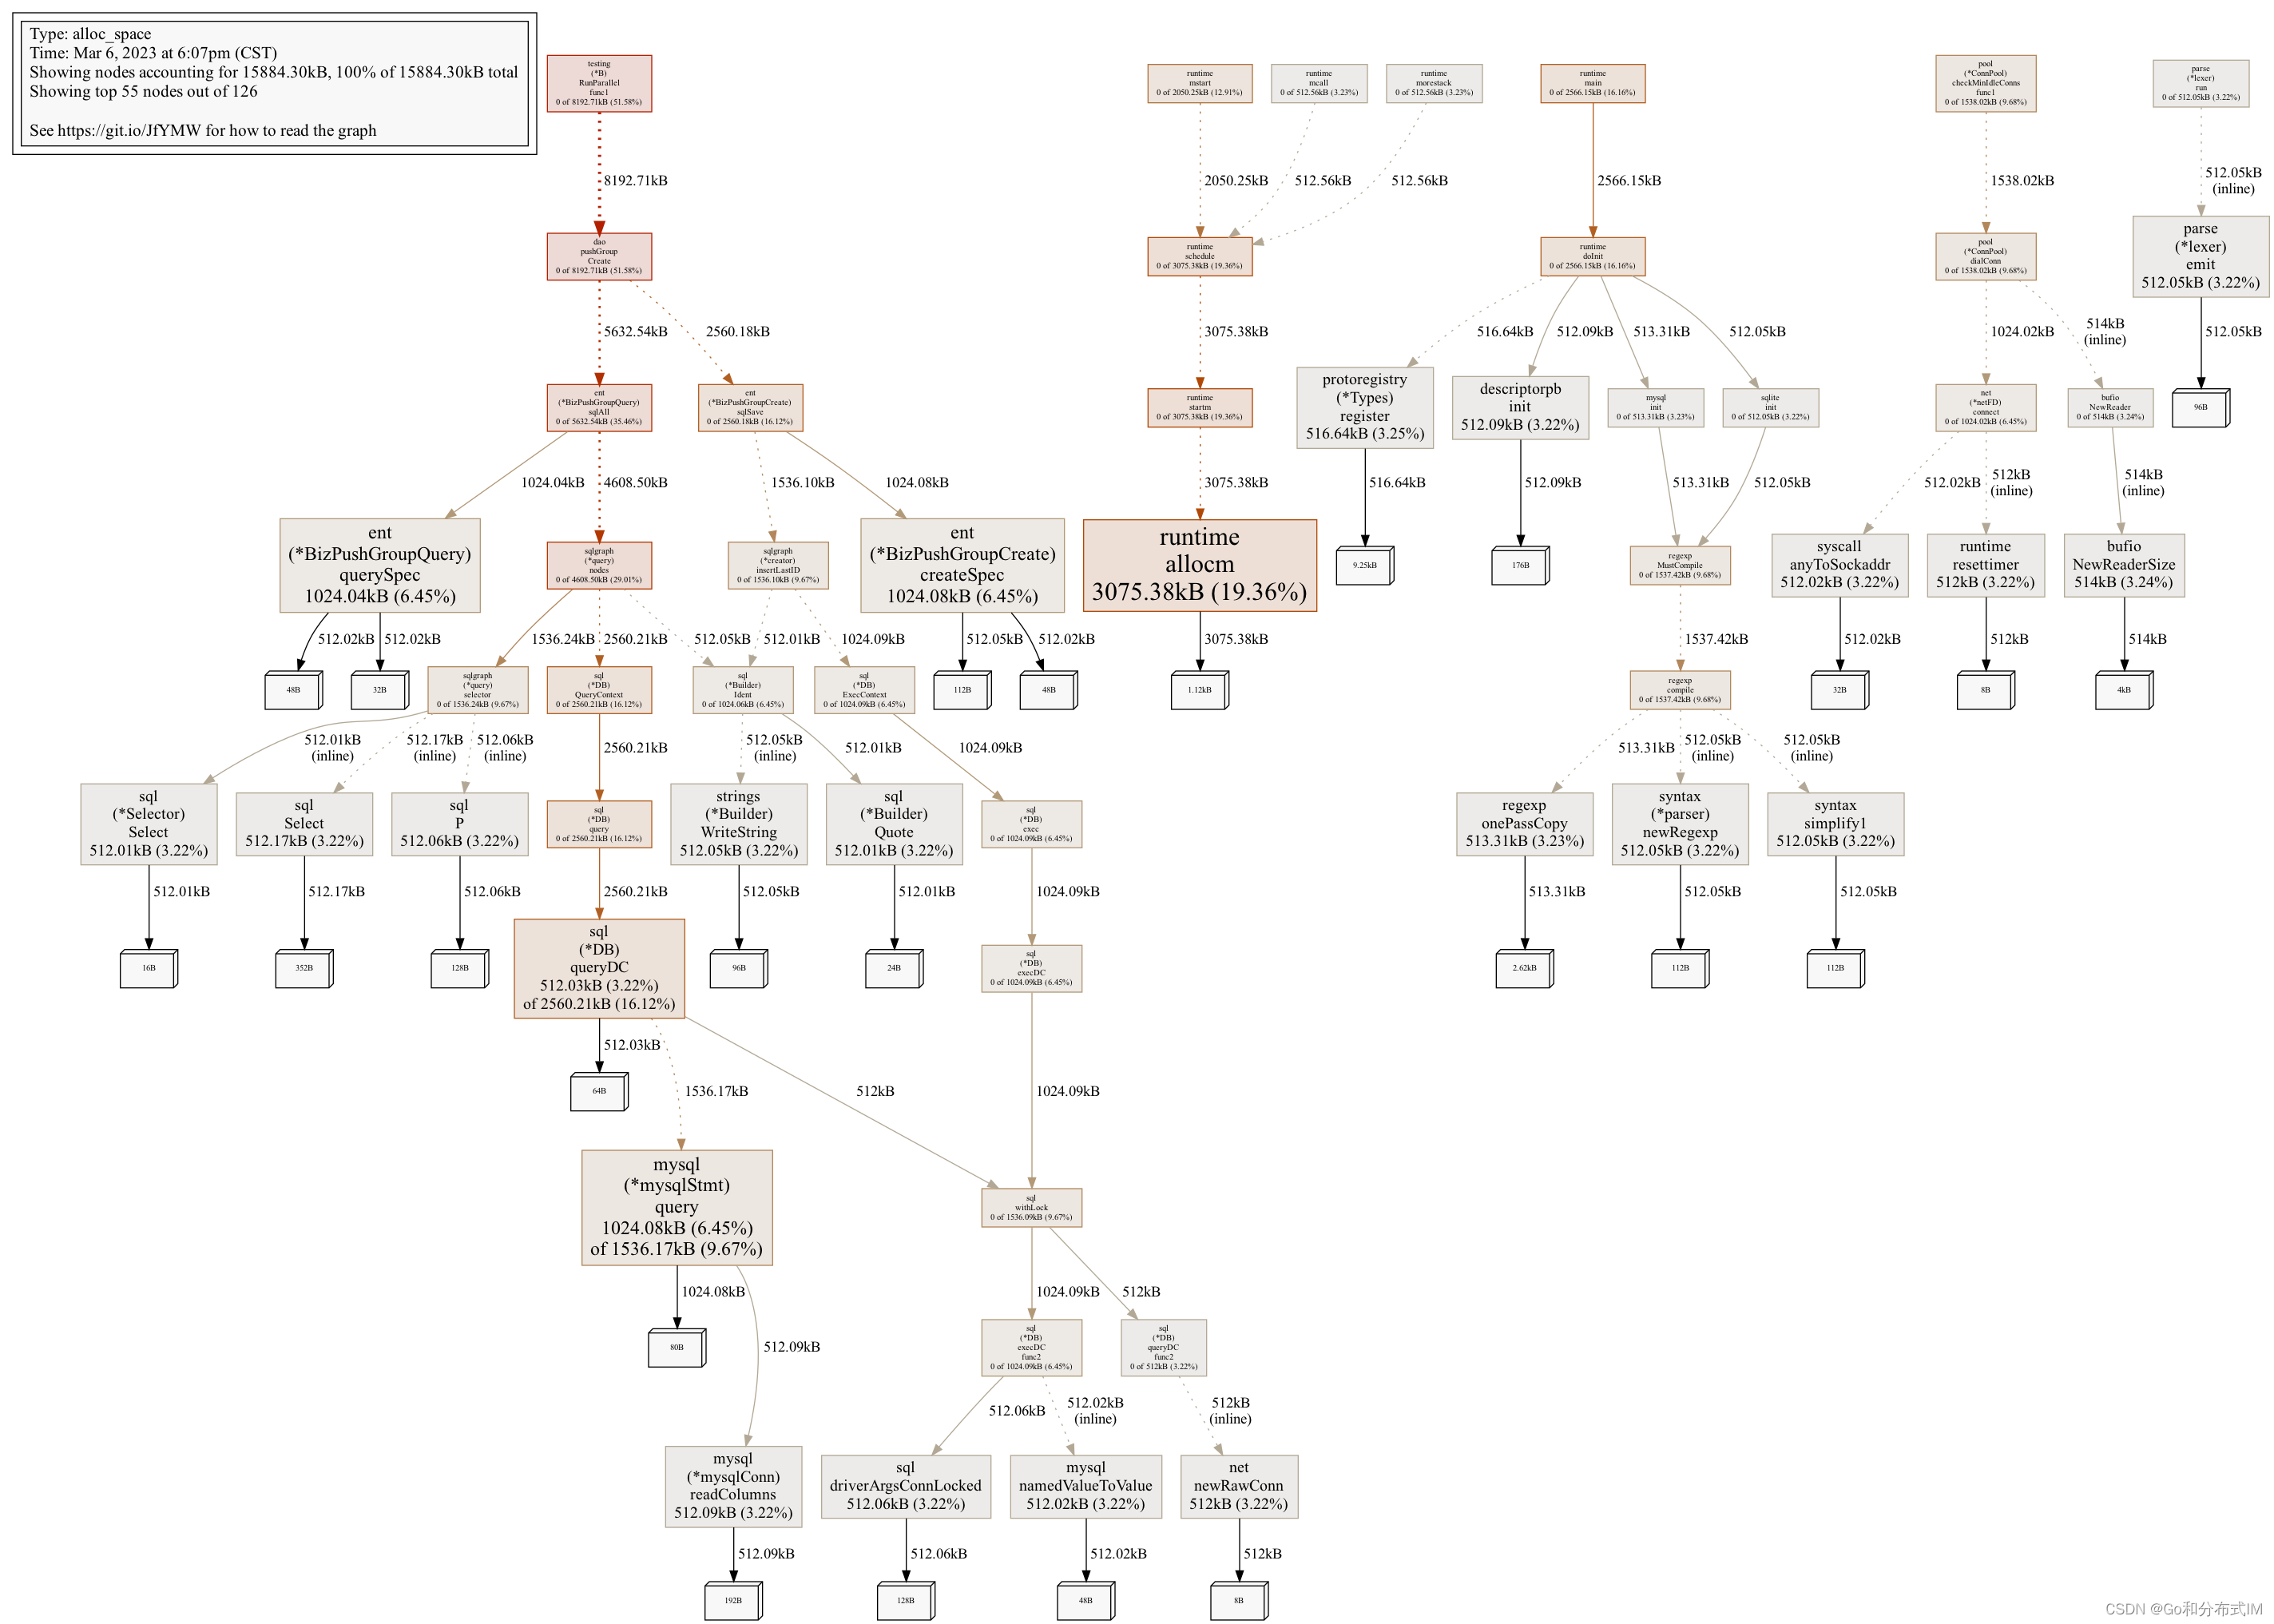
142 allocs/op:表示每次函数操作会涉及 142 次内存分配,因为这里使用的 ent orm框架,这个数字看起来也不算夸张。6138 B/op:表示1次函数调用会分配 6138 Bytes内存。我们还可以结合 -memprofile 命令导出性能文件,然后使用 pprof 工具来进行精确分析内存分配和占用情况。
$ go test -run=none -bench="BenchmarkPushGroup_Create$" -benchmem -memprofile="out.profile"
(pprof) top 10
Showing nodes accounting for 9227.88kB, 58.09% of 15884.30kB total
Showing top 10 nodes out of 126
      flat  flat%   sum%        cum   cum%
3075.38kB 19.36% 19.36%  3075.38kB 19.36%  runtime.allocm
1024.08kB  6.45% 25.81%  1024.08kB  6.45%  server/msg-dispatcher/internal/dao/ent.(*BizPushGroupCreate).createSpec
1024.08kB  6.45% 32.26%  1536.17kB  9.67%  github.com/go-sql-driver/mysql.(*mysqlStmt).query
1024.04kB  6.45% 38.70%  1024.04kB  6.45%  server/msg-dispatcher/internal/dao/ent.(*BizPushGroupQuery).querySpec
  516.64kB  3.25% 41.95%   516.64kB  3.25%  google.golang.org/protobuf/reflect/protoregistry.(*Types).register
     514kB  3.24% 45.19%      514kB  3.24%  bufio.NewReaderSize
  513.31kB  3.23% 48.42%   513.31kB  3.23%  regexp.onePassCopy
  512.17kB  3.22% 51.65%   512.17kB  3.22%  entgo.io/ent/dialect/sql.Select
  512.09kB  3.22% 54.87%   512.09kB  3.22%  github.com/go-sql-driver/mysql.(*mysqlConn).readColumns
  512.09kB  3.22% 58.09%   512.09kB  3.22%  google.golang.org/protobuf/types/descriptorpb.init
png 导出成图片:
(pprof) png
Generating report in profile001.png
看下图最左侧 pushGroup.Create的树形图,分配情况一目了然:
以 斐波拉契数列 为例,当我们需要评估算法是O(1)、O(N)、O(n^2)还是其他时间复杂度时,如果看代码不好判断(比如递归版本的解法):
func Fib(n int) int {
   if n == 0 || n == 1 {
      return n
   }
   return Fib(n-2) + Fib(n-1)
}
这种情况下,我们可以通过测试不同输入的函数耗时,然后放到折线图中判断。在下面的代码中,我们通过b.Run运行子测试的功能,一次性测试计算第10、30和40位的斐波拉契数列:
func BenchmarkFib_Table(b *testing.B) {
   var table = []int{10, 30, 40}
   for i := 0; i < len(table); i++ {
      num := table[i]
      name := fmt.Sprintf("%s_%d", "BenchmarkFib", num)
      b.Run(name, func(b *testing.B) {
         benchFib(b, num)
      })
   }
}

func benchFib(b *testing.B, num int) {
   for n := 0; n < b.N; n++ {
      Fib(num)
   }
}
输出:
goos: darwin
goarch: arm64
pkg: goexample/13_benchmark
BenchmarkFib_Table/BenchmarkFib_10-10            4750002               250.3 ns/op
BenchmarkFib_Table/BenchmarkFib_30-10                314           3787747 ns/op
BenchmarkFib_Table/BenchmarkFib_40-10                  3         467186889 ns/op
PASS
ok      goexample/13_benchmark  6.110s
转换成折线图(1-30):
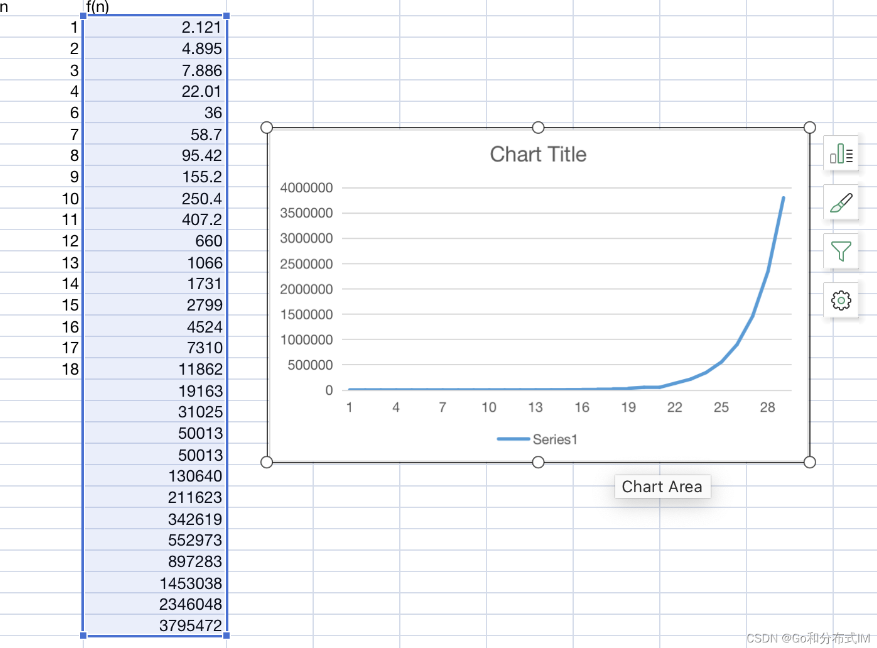
我们可以直观看到这个线的走势,从20左右开始,折线就急剧爬升。到了30后面,几乎就是90度的走向了,所以从这根线的走势可以看出,递归版本的 斐波拉契 解法的时间复杂度,肯定不是 O(n),至少是 O(n^2) 级别,关于该递归解法的时间复杂度分析可以参考这篇文章:递归求Fibonacci数列的时间复杂度到底是多少?
如果你省略 -run 指令,其实也会运行 同一个package 下的所有单测:
$ go test -bench="BenchmarkFib_40$"
goos: darwin
goarch: arm64
pkg: goexample/13_benchmark
BenchmarkFib_40-10             3         469632750 ns/op
PASS
ok      goexample/13_benchmark  3.235s
从上面的输出看不出啥,那是因为你的单测全部 PAAS,不相信的话,我们可以加个 -v 把执行的单测详情输出看看:
$ go test -bench="BenchmarkFib_40$" -v
=== RUN   TestFib
--- PASS: TestFib (0.00s)
=== RUN   TestFibIterator
--- PASS: TestFibIterator (0.00s)
goos: darwin
goarch: arm64
pkg: goexample/13_benchmark
BenchmarkFib_40
BenchmarkFib_40-10             3         468810389 ns/op
PASS
ok      goexample/13_benchmark  2.999s
所以,如果我们需要显示跳过单测,一定别忘记给 -run 指令指定一个不匹配任何单测的正则,即可跳过单测,只运行 benchmark测试。
$ go test -run="none" -bench="BenchmarkFib"
golang.org/x/perf 中提供了一组工具,可以对 benchmark 结果进行分析,其中一个很有用的工具就是 benchstat,可以对2次benchmark结果进行A/B比较,让我们以 斐波拉契数列 为例来演示一下。
func BenchmarkFib_Table(b *testing.B) {
   nums := []int{10, 20, 30}
   for i := 0; i < len(nums); i++ {
      num := nums[i]
      name := fmt.Sprintf("%d", num)
      b.Run(name, func(b *testing.B) {
         for n := 0; n < b.N; n++ {
            Fib(num)              // (1)
            // FibIterator(num)   // (2)
         }
      })
   }
}
递归算法版本 的测试并保存文件
$ go test -bench="BenchmarkFib$" -run=none -count 2 | tee old.txt
* `-count`:会执行2遍测试
* `tee`:会把测试结果保存成文件,同时把结果输出到控制台。
迭代版本解法 的测试并保存文件
# 注释(1)位置的代码,取消(2)位置代码的注释然后运行
$ go test -bench="BenchmarkFib$" -run=none -count 2 | tee new.txt
benchstat 工具
$ go install golang.org/x/perf/cmd/benchstat@latest
$ benchstat old.txt new.txt
输出:
goos: darwin
goarch: arm64
pkg: goexample/13_benchmark
                │      old.txt       │                new.txt                │
                │       sec/op       │    sec/op     vs base                 │
Fib_Table/10-10       238.550n ± ∞ ¹   3.743n ± ∞ ¹        ~ (p=0.333 n=2) ²
Fib_Table/20-10     29431.000n ± ∞ ¹   6.889n ± ∞ ¹        ~ (p=0.333 n=2) ²
Fib_Table/30-10   3637274.000n ± ∞ ¹   9.976n ± ∞ ¹        ~ (p=0.333 n=2) ²
geomean                 29.45µ         6.360n        -99.98%
* `sec/op`:代表每次运行的平均耗时
* `geomean`:递归版本平均耗时 `30.84 us`,迭代版本解法平均 `6.6 ns`,性能提升了 `99.98%`。
更多关于 bench stat工具可以参考:官方文档
通过指定 -cpuprofile 可以输出cpu信息到文件中,然后就可以使用pprof来进行更深入的分析了。
举一个实际案例,假设要分析某个函数的耗时:
$ go test -run="none" -bench="BenchmarkPushDevice_BindOrUpdate" -cpuprofile=out.cpu
输出:
goos: darwin
goarch: arm64
pkg: internal/biz
BenchmarkPushDevice_BindOrUpdate-10           18          66413139 ns/op
PASS
ok      internal/biz      3.678s
我们发现这个 BindOrUpdate 1秒执行了18次,平均66ms执行一次。
这个性能比预期低,让我们使用 go tool中的 pprof 工具,调查一下到底是哪里比较耗时(微服务中一般使用trace分析函数耗时)。
使用 pprof 加载文件:
$ go tool pprof out.cpu

Type: cpu
Time: Feb 16, 2023 at 4:47pm (CST)
Duration: 2.86s, Total samples = 120ms ( 4.19%)
Entering interactive mode (type "help" for commands, "o" for options)
(pprof)
输入 top:
(pprof) top

Showing nodes accounting for 120ms, 100% of 120ms total
Showing top 10 nodes out of 112
      flat  flat%   sum%        cum   cum%
      40ms 33.33% 33.33%       40ms 33.33%  syscall.syscall
      20ms 16.67% 50.00%       20ms 16.67%  runtime.kevent
      20ms 16.67% 66.67%       20ms 16.67%  runtime.pthread_cond_signal
      10ms  8.33% 75.00%       10ms  8.33%  internal/dao/ent.newBizPushUserDeviceMutation
      10ms  8.33% 83.33%       10ms  8.33%  runtime.(*limiterEvent).stop
      10ms  8.33% 91.67%       10ms  8.33%  runtime.(*spanSet).push
      10ms  8.33%   100%       10ms  8.33%  runtime.step
         0     0%   100%       20ms 16.67%  bufio.(*Reader).ReadSlice
         0     0%   100%       20ms 16.67%  bufio.(*Reader).fill
         0     0%   100%       10ms  8.33%  context.WithDeadline
(pprof)
好像看不出啥,我们可以继续使用 list newBizPushUserDeviceMutation 挨个查看详情,考虑到篇幅这里就不再过多介绍了。
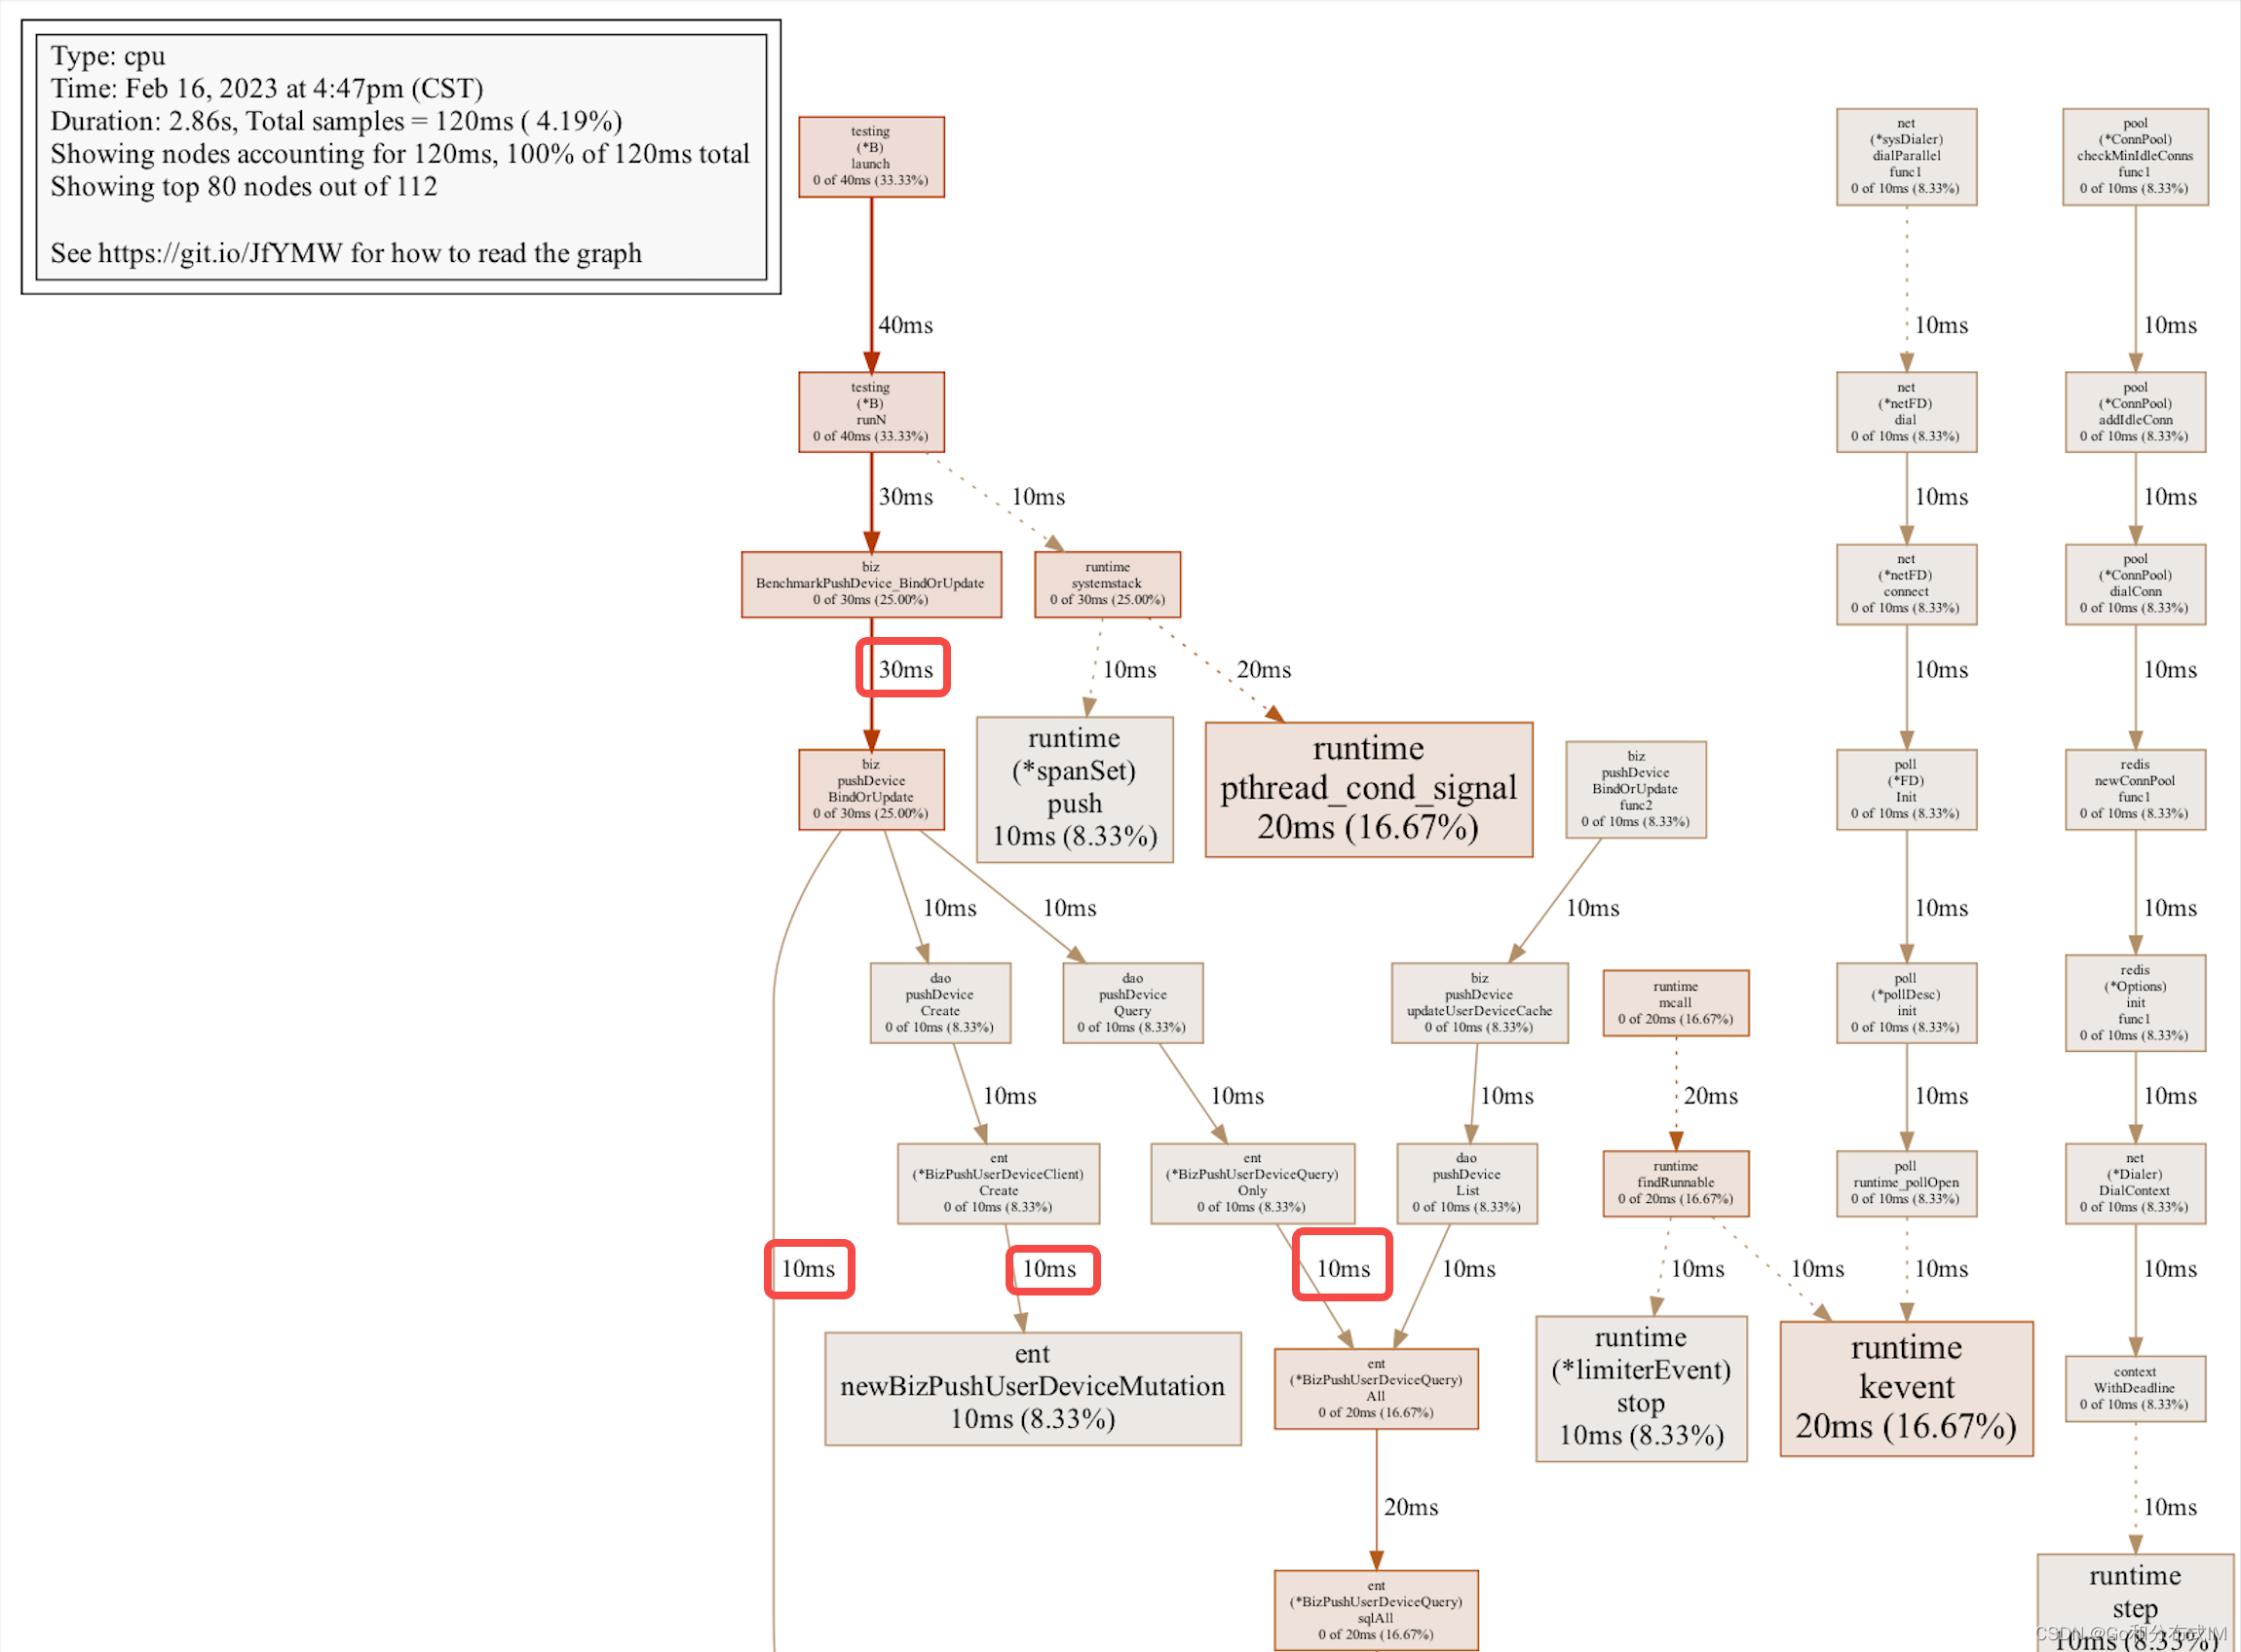
输入 png 导出(help查看更多pprof命令):
(pprof) png
Generating report in profile001.png
打开 png,我们看到下面3个红框的位置,分辨有3个操作每个耗时10ms(mysql操作),他们是顺序执行,所以会占用30ms,总计40ms耗时左右,1秒钟也就执行25次,和压测结果接近,至此,我们结合pprof找到了函数耗时的点,可以做针对性的性能优化了,是不是很方便?
我们可以通过 ResetTimer 忽略初始化需要的时间,通过 StartTimer 和 StopTimer 忽略某一段代码的耗时,如下是一个示例:
func BenchmarkNewPushDevice(b *testing.B) {
   entClient := newEntClient(b)
   redisClient := unittest.NewRedis(b)
   member := NewPushGroupMemberDao(entClient, redisClient)
   group := NewPushGroupDao(entClient, redisClient, member)

   // 忽略 redis,mysql 等初始化占用的时间
   b.ResetTimer()

   b.SetParallelism(4)
   b.RunParallel(func(pb *testing.PB) {
      for pb.Next() {
         // 忽略这段代码的耗时
         b.StopTimer()
         _ = group.Create(context.Background(), rand.Int()%100000)
         b.StartTimer()

         err := member.Add(context.Background(), rand.Int())
         assert.NoError(b, err)
      }
   })
}
总结
本文罗列了实战中可能会用到的各种小技巧,包括:
提升准确度:-benchtime 和 -count 的使用内存分配情况:-benchmem 和 -memprofile 的使用测试不同的输入:b.Run运行子测试,验证时间复杂度跳过单元测试:可以通过 -run 指定一个不匹配任何单测的正则来跳过对比benchmark结果:使用 bench stat 工具,对比2次测试结果结合pprof进行函数耗时分析:-cpuprofile 指令的使用,并演示如何结合pprofile工具进行可视化分析。ResetTimer & StartTimer & StopTimer 的使用benchmark常用命令如下(完整命令):
-cpu 1,2,4
    Specify a list of GOMAXPROCS values for which the tests, benchmarks or
    fuzz tests should be executed. The default is the current value
    of GOMAXPROCS. -cpu does not apply to fuzz tests matched by -fuzz.

-benchtime t
    Run enough iterations of each benchmark to take t, specified
    as a time.Duration (for example, -benchtime 1h30s).
    The default is 1 second (1s).
    The special syntax Nx means to run the benchmark N times
    (for example, -benchtime 100x).

-benchmem
    Print memory allocation statistics for benchmarks.

-count n
    Run each test, benchmark, and fuzz seed n times (default 1).
    If -cpu is set, run n times for each GOMAXPROCS value.
    Examples are always run once. -count does not apply to
    fuzz tests matched by -fuzz.

-cpuprofile cpu.out
    Write a CPU profile to the specified file before exiting.
    Writes test binary as -c would.

-memprofile mem.out
    Write an allocation profile to the file after all tests have passed.
    Writes test binary as -c would.
作者简介:一线Gopher,公众号《Go和分布式IM》运营者,开源项目: CoffeeChat 、interview-golang 发起人 & 核心开发者,终身程序员。
参考: